


September 7, 2023
Peaker Power Plant Data Show Persistent Economic and Racial Inequities
By Seth Mullendore
Data released by the Environmental Protection Agency (EPA) shows that little has changed across the peaker power plant landscape. As Clean Energy Group (CEG) first reported a year and a half ago, inefficient and expensive fossil fuel peaker power plants continue to be predominantly located near lower-income communities and the vast majority of communities that are most impacted by peaker plant emissions continue to be those communities with higher proportions of people of color. Many of these power plants can be reliably and cost-effectively replaced with clean, emission-free resources, representing an immense opportunity to remove significant sources of pollution from environmental justice communities across the country.
CEG completed an update of our Peaker Plant Mapping Tool to incorporate emissions data recently published by the EPA. The EPA data includes emissions and operational information for all 3,749 power plants operating in the US in 2021, along with demographic details about the communities within a three-mile radius of each power plant. CEG analyzed the information for the country’s peaker power plants, defined as any combustion-based power plant that operates less than 20 percent of year, known as the plant’s capacity factor, and has a power rating of at least 10 megawatts.
Based on our assessment, not a whole lot has changed since EPA’s last dataset was released in 2019.
There are still a bunch of peakers on the grid, 1,199 in total, which is roughly the same as 2019. And the country’s peakers still don’t operate very often. The average peaker capacity factor remained steady at 4 percent. That translates into 350 hours per year, or an average of about 14 and a half days of intermittently producing electricity throughout the year.
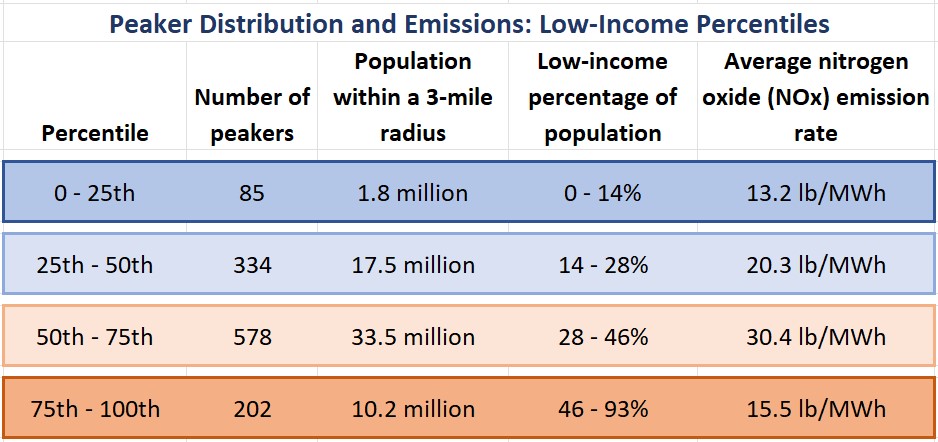
Peakers are still predominantly located in and near lower-income communities. Two-thirds of all peaker power plants are sited in communities with a higher percentage of low-income residents than the average town in the US (represented by the 50th percentile). In total, 780 peakers have surrounding communities where at least 28 percent of households have incomes less than or equal to twice the federal poverty level. More than 200 of those peaker plants impact communities with low-income rates of 46 percent or higher (above the 75th percentile).
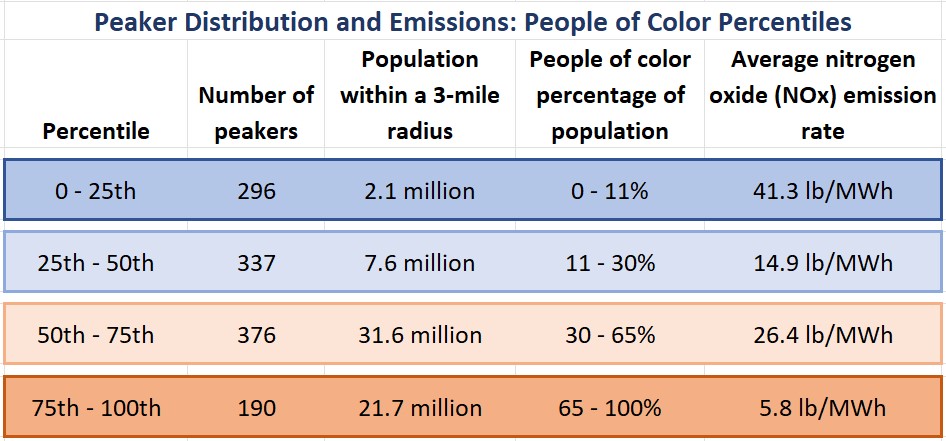
As in 2019, people of color are still disproportionately impacted by harmful peaker emissions. 63 million Americans live within three miles of a peaker plant, 84 percent of whom also live in a community that has a higher proportion of non-white residents. One reason for this glaring disparity is the fact that peakers are often located near load pockets where demand for energy is high and the grid is congested – that means cities. Within cities, the siting of peakers follows clear trends along racial and poverty lines. Lower-income communities represent 69 percent of the population living near a peaker plant. When accounting for both race and income level, 38 million people, 60 percent of everyone near a peaker, live in a community that is both lower income and less white than the average American town.
Even as these trends remained the same over time, two notable changes did occur.
First, the overall generating capacity of the peaker fleet dropped by 25 percent, from 364 gigawatts in 2019 to 272 gigawatts in 2021. In some cases, this is very good news. For example, the 3,000-megawatt Moss Landing gas plant in California has been retired and the site now hosts the world’s largest battery storage system. Some peakers significantly reduced their maximum power rating, indicating that some turbines may have been decommissioned, such as at the Ravenswood Generating Station in Queens, New York City, which reduced its peaking capacity by nearly 500 megawatts. In other cases, power plants were utilized more often, bumping them out of peaker territory into an intermediate power plant operating more than 20 percent of the year, so they aren’t really gone, which is not such good news.
Second, average nitrogen oxide (NOx) emissions rates increased significantly. In 2019, the average NOx emission rate for all peakers was 15.3 lb/MWh. In 2021 the NOx emission rate jumped to 23.9 lb/MWh, more than a 50 percent increase. This is important because NOx is a significant contributor to serious respiratory and cardiovascular conditions in surrounding communities, leading to higher levels of illness and premature mortality.
The reason behind this NOx increase is not entirely clear. It could be that, on average, peakers were operated less efficiently in 2021. Increased need for ramping up and down or idling on standby during times of grid stress could result in higher emissions for the same level of electricity production. In some cases, peakers had massive changes in their NOx emissions rates between the two EPA datasets.
CEG dug into additional data sources to investigate this change for a few power plants but did not discover any consistent answer for why this was occurring. The most egregious example of increased NOx emissions was a 38-megawatt peaker plant operated by the City of Princeton, Illinois. The power plant’s NOx rate increased by a factor of 280 times, from 15 lb/MWh in 2019 to a mind-boggling 4,200 lb/MWh in 2021. Based on information the power plant operator provided to the Energy Information Administration, the peaker began consuming significantly more fuel in 2021 while producing only marginally more electricity. Perhaps this was just a reporting error, but there were many similar anomalies in the data that have raised questions about the accuracy of emissions tracking and reporting mechanisms. If communities don’t have accurate information about the facilities impacting their neighborhoods, it becomes even more challenging to fight ongoing injustices.
Looking at the data as a whole, there have been very few changes in the distribution of peakers across the country and the composition of communities most harmed. However, this high-level look obscures the wins and losses happening on the ground in frontline communities. In New York City, the PEAK Coalition has been instrumental in accelerating the retirement of multiple peaker plants but is now facing headwinds as the state lags in the development of clean alternatives. In Massachusetts, groups have struggled to stop construction of what may be the last new gas peaker built in the state, but a new coalition has formed to fight peakers impacting environmental justice communities. In many states, utilities still prop up gas plants as the default option for grid reliability, even as gas has failed again and again to perform when called upon during extreme weather conditions.
The reality is that clean, reliable alternatives to fossil fuel peaker plants are already widely available. California is aggressively installing energy storage to provide grid flexibility and meet peak power demand. New York is building new transmission lines to relieve grid congestion in New York City. Texas just approved aggregations of small-scale customer resources, like batteries and electric vehicles, to form virtual power plants that can respond when the grid is stressed.
Pathways already exist for the replacement of polluting peaker plants. It is just a matter of prioritizing and implementing the policies and procedures to make this transition happen and put an end to the injustices peakers have inflicted on low-income communities and people of color for decades.


