Peaker Power Plant Mapping Tool
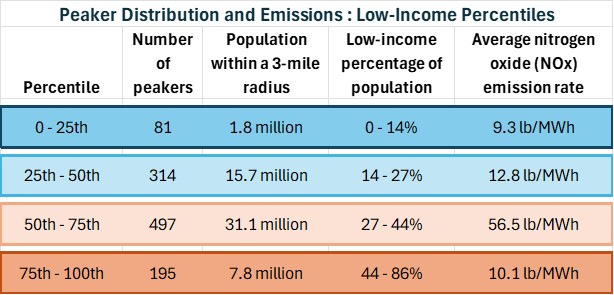
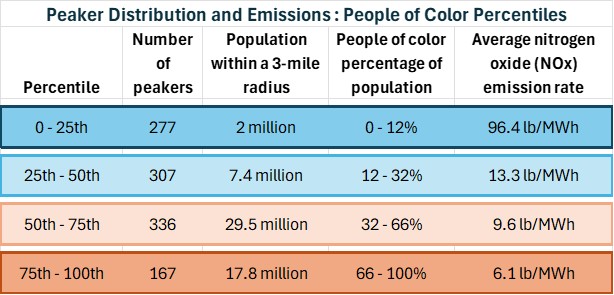
Clean Energy Group’s Peaker Plant Mapping Tool allows users to access basic operating and emissions information for the U.S. fleet of fossil-fuel peaker power plants, along with demographic information about populations living near each power plant. Peaker plant demographic information can be viewed in three ways: Low Income Percentile, People of Color Percentile, and Demographic Index Percentile (average of Low Income and People of Color). The data indicates significant racial and economic disparities in the communities that are most burdened by peaker plant emissions.
All information included in the tool is based on data made available by the U.S. Environmental Protection Agency through the agency’s Power Plants and Neighboring Communities Mapping Tool (2022 operating and emission data).


