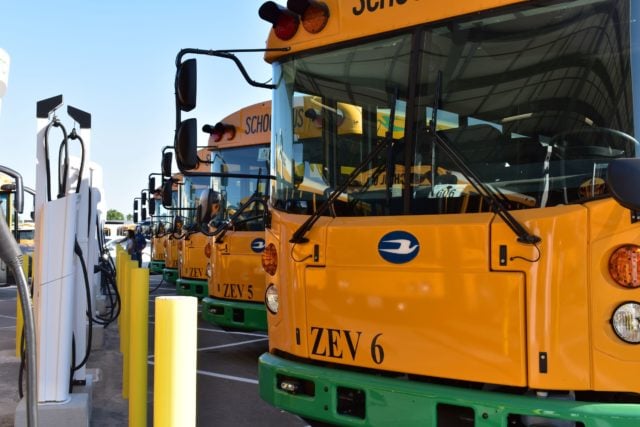
What Nonprofits Need to Know about the Investment Tax Credit

Photo Credit: Serenethos/Bigstock.com

Photo Credit: Serenethos/Bigstock.com

By Anna Adamsson, Clean Energy Group 

The Inflation Reduction Act of 2022 (IRA) updated and expanded the Investment Tax Credit (ITC) for solar and battery storage resilient power projects. The ITC, which was previously set at a 26% credit for 2023 and a 10% credit for every year after that, was updated and raised to cover 30% of eligible installation costs through 2032. This change significantly increases the anticipated savings for solar projects and will help create stability in the market over the next decade.

Congress also expanded the ITC in three crucial ways: 1) Nonprofits with no tax liability can now apply for direct pay reimbursement equal to the value of the tax credit 2) Storage-only projects are now eligible for the ITC. 3) The ITC now includes several ‘bonus credits’, which can significantly increase savings for projects serving low-income and underserved communities. These important changes are outlined in further detail below.

What kind of clean energy technology is eligible?

The ITC formerly could only be applied to energy storage if it was installed with solar or wind power. Now standalone storage projects, in addition to solar only and solar combined with storage projects, are eligible for the ITC. The change to include storage only projects will increase access to storage, including for organizations who have already installed solar and may now want to explore adding resilient battery storage to their facility.

Can nonprofits benefit from the Investment Tax Credit?

Importantly, the ITC can now benefit everyone, not only those that have tax liability. Nonprofits and other tax-exempt entities – like municipalities and Tribal governments – are eligible to receive the ITC in the form of a direct pay reimbursement.

The Treasury Department and Internal Revenue Service (IRS) will release guidance this year about how tax-exempt organizations can apply for reimbursement and when they can expect repayment. At this time, organizations should expect they will need to pay for the cost of the system upfront (optionally with assistance from a low or no interest loan) and receive the direct payment within one to two years.

How much is the ITC worth?

The ITC was also increased to 30% baseline credit for projects installed before 2033. This applies to projects under 5 megawatts capacity or for larger projects that meet manufacturing and workforce requirements. Projects may be eligible for up to six bonus credits that could raise the value of the ITC up to 70% of the cost of the project’s installation.

Bonus Credits

The ITC includes six different bonus credits that projects may apply for. Four of those credits are housed within the Low-Income Communities Bonus Credit Program, which the IRS released preliminary guidance for on February 13, 2023 (available to view here). The IRS is expected to release additional guidance on that program later this year. Currently, projects can only apply for one of the four bonus credits within the Low-Income Communities Bonus Credit Program. This means a project could either receive a 10% or 20% bonus credit, depending on their eligibility.

The four bonus credits within the Low-Income Communities Bonus Credit Program are:

  • 10% bonus for projects located in a low-income community
  • 10% bonus for projects located on Tribal Land
  • 20% bonus for projects when the facility is part of a qualified low-income residential project
  • 20% bonus for projects when the facility is part of a qualified low-income economic benefit project

The ITC also includes two additional 10% credits, which are stackable. Projects who are eligible can apply for both bonus credits, in addition to the 30% baseline credit and one of the bonus credits within the Low-Income Communities Bonus Credit Program. The IRS has not released detailed guidance about how these credits will be implemented.

The two stackable bonus credits are:

  • 10% bonus for projects located in an “energy community”
  • 10% bonus for projects that meet domestic manufacturing requirements

(Read more about all of these six bonus credits in a series of fact sheets that CEG published HERE.) 

The following two sections focus on the guidance released by the IRS about the Low-Income Communities Bonus Credit Program: what we’ve learned and what we still have questions about.

Answers to Frequently Asked Questions about the Low-Income Communities Bonus Credit Program

What kind of clean energy technology is eligible?

The adders within the Low-Income Communities Bonus Credit Program can only be applied to solar or wind projects or projects that pair storage with solar or wind. While standalone storage is eligible for the 30% ITC baseline, it is not eligible for any of these adders (IR-2023-26, Section 2). The maximum net output of the system must be less than 5 megawatts and it must be less than the ‘nameplate capacity of the facility’ (Section 4.08).

When should I apply for these adders?

The Department of Energy (DOE) will accept applications for the Low-Income Communities Bonus Credit Program in the third quarter of 2023. Eligible projects must apply for the adder before the project is installed and ‘placed in service’ (Section 4.05; defined in Section 2.06 of the IRS’ guidance). The application for the two 20% adders will be open for 60-days in Quarter 3 of 2023; the application for the two 10% adders will be available for 60-days later in the year (Section 4.07). The IRS will release more guidance before the application windows begin. Your developer should assist you in applying for these credits.

How likely is it that my project will be approved and receive an adder?

Eligible projects that apply for an adder are not guaranteed to receive the adder. If demand exceeds supply and an eligible project is not approved for an adder, then that project team can decide to reapply the next year (Section 4.06). The Low-Income Communities Bonus Credit Program will approve up to 1.8 gigawatts worth of projects in 2023. The program has reserved 700 megawatts of capacity for projects located in a low-income community (10% credit) and an additional 700 megawatts of capacity for qualified low-income economic benefit projects (20% credit). Projects located on Tribal Land (10% credit) and qualified low-income residential building projects (20% credit) are each allotted another 200 megawatts of capacity in 2023.

The IRS Department may release additional criteria for the adders to prioritize applications for projects owned or developed by community-based organizations and mission-driven entities or that would provide substantial benefits to low-income communities, for example (Section 4.02).

What if I have more questions?

You can reference the most recent guidance released by the IRS (IR-2023-26) or visit the IRS’ website for the Inflation Reduction Act. This post will be updated when the Treasury Department and Department of Energy release more guidance regarding the four adders within the Low-Income Communities Bonus Credit Program. You can also reach out to Anna from Clean Energy Group (anna@cleanegroup.org).

Opportunities for the IRS to Provide Clarity in Future Guidance about the Low-Income Communities Bonus Credit Program

Some questions remain unanswered by the current guidance:

  • How soon will applicants receive notice of whether their project is eligible for the adder that they applied for?
  • If an eligible project applies for a 20% adder, but their application is not accepted because of capacity restraints, can the project apply for the 10% adder in the same year?
  • Projects need to apply to these adders before their project is installed. How do these adders interact with the 30% baseline credit, which historically has been applied only after the installation of the project?
  • In both the 20% adder for affordable housing and the 20% adder for qualified low-income economic benefit projects, the financial benefits of the project must be shared equitably with low-income households (Section 3.03 and Section 3.04). What qualifies under this provision? For example, if the financial benefits are restricted to funding improvements for shared community spaces, would that qualify? If the financial benefits are restricted to funding community programming like financial literacy courses, would that qualify?
  • How will community solar projects be assessed for eligibility for these adders?

Additional Resources

If you are a community services provider or an affordable housing provider interested in pursuing solar+storage under the ITC, you may be eligible for CEG’s Technical Assistance Fund. For more information, visit the Technical Assistance Fund website.

Electric Vehicles in the Community: Benefits and Challenges

By Michael Brower, for Clean Energy Group. This blog is the second in a series exploring the topic of electric vehicles and equity. Read part 1 here.

Stockton Unified School District’s new electric bus fleet reduces over 120,000 pounds of carbon emissions. Photo Credit: The Mobility House. Used with permission.

When environmental problems and disasters strike, they often hit disadvantaged communities the hardest.

Whether it’s diesel fumes from aging school buses, or hurricanes causing massive flooding and power outages, communities that are home to predominantly low-income people and people of color often bear the brunt of the consequences.¹

Electric vehicles (EVs) for community use – including electric buses, vans, trucks, and ordinary passenger cars – represent an important opportunity for mitigating these problems. They can help lower the costs of delivering community services while reducing the exposure of children, the elderly, and other vulnerable groups to harmful air pollutants. With two-way charging, they can even help make electric power grids more resilient and protect against power outages, which can leave communities without access to health services, safe food, drinking water, medicines, and other essentials.

This blog delves into the opportunities for EVs that are within reach for many communities and the economic, environmental, and public health benefits they can provide.

Air Pollution and Public Health

Surveys show that people from all walks of life care deeply about the effects of pollution, specifically air pollution, on their health and wellbeing. According to Gallup, for example, some 75% of Americans surveyed in 2018 report being concerned either a “great deal” or a “fair amount” by air pollution.2 Air pollution is typically viewed as more urgent and having a greater immediate impact on health and wellbeing than other issues such as climate change.

Public concern reflects the reality that – although pollution levels have come down enormously in the decades since the Clean Air Act was passed in 1963 – air pollution still causes significant health problems. According to the Environmental Protection Agency (EPA), over 100 million Americans (nearly one in three) live in counties where the air quality fails to meet health standards.3 Studies show that fine particulate matter (PM2.5) and ozone (O3), two especially harmful byproducts of combustion, cause some 100,000-200,000 premature deaths in the United States annually.4 About a quarter of these deaths are due to emissions from road vehicles. Air pollutants, most importantly PM2.5, are also responsible for millions of asthma attacks and other respiratory health complications every year and are implicated in delayed cognitive development and growth in children.5

As bad as that sounds, the American Lung Association (ALA) observes that “the burden of air pollution is not evenly shared.”6 Lower income households and communities of color often experience greater exposure to air pollutants and, just as important, have fewer resources to address their health impacts. An EPA-funded study published in 2019 concluded that people of color, on average, are exposed to about 25% more fine particulate matter than Whites.7 Among Blacks, average exposure is 34% higher than for Whites. Nor do the averages tell the whole story. The research shows that people of color are over three times more likely to be exposed to the highest concentrations of harmful air pollutants than Whites.8

The disparity in exposure is not primarily driven by income, as some might assume. As one of the co-authors of the EPA-funded study notes, “Because the data shows that the racial disparities hold for all income levels, our study reinforces previous findings that race/ethnicity, independently of income, drives air pollution-exposure disparities.” Compared to Whites, people of color tend to be more exposed to pollutants associated with industrial and urban activity. As another co-author stated, “The inequities we report are a result of systemic racism: Over time, people of color and pollution have been pushed together, not just in a few cases but for nearly all types of emissions.”9 (See Figure 1).

Figure 1. Results of an EPA-funded study by researchers at several universities, which estimated the relative exposure to PM2.5 of people in 5 groupings: White, People of Color, Black, Hispanic, and Asian. The charts show the proportion of members of each group exposed to above-average (red bars) or below-average (blue bars) concentrations of pollutants both in absolute (charts A-E) and relative (charts F-J) terms. Source: https://www.science.org/doi/10.1126/sciadv.abf4491

While road vehicles are not the only source of harmful air pollution – industry, coal-fired power generation, and construction make important contributions – they are one source of pollution that communities can take direct action to address. Lacking tailpipes, electric vehicles – including school buses, vans, and passenger vehicles – directly eliminate harmful pollutant emissions including particulates, ozone, carbon monoxide, and nitrogen oxides. In the transportation sector, replacing diesel trucks and buses with EVs presents probably the biggest single opportunity for reducing pollutant exposures in communities, for they produce far more fine particulates than do gasoline vehicles.

Cost Savings

Besides addressing an important public health hazard, electric vehicles can help communities meet their budget challenges. They can lower vehicle fueling costs by half, or more, thanks to their higher efficiency and the lower cost of electricity per unit of energy delivered compared to gasoline or diesel fuel. Counting all operating expenses including insurance, tires, registration, and maintenance, they are typically 25% less expensive to run than their conventional equivalents. See Table 1 for a comparison of two vehicle types with gasoline and EV versions: the Ford F-150 pickup and the Hyundai Kona.

Table 1 . Comparison of fuel and operating costs of EV and gasoline versions of two leading vehicle models. Source: US DOE Alternative Fuels Data Center calculator (https://afdc.energy.gov/calc/, accessed February 10, 2023). Assumptions: Gasoline $3.86/gallon (national average price for mid-grade gasoline as of February 10, 2023, according to the American Automobile Association). Electricity $0.195/kWh (based on New York State prices). Annual miles driven: 12,000 (5316 city, 6684 highway).

The upfront costs for EVs tend to be higher than for conventional vehicles, but the total cost of ownership is generally similar, and the greater the annual and cumulative mileage, the more the cost comparison favors EVs. For the vehicles shown in Figure 2, the Hyundai Kona EV is more expensive to own than the conventional Kona over the first 12 years, after that becoming less expensive, whereas the F-150 Lightning is less expensive to own than the conventional F-150 over nearly the entire life of the vehicles. These comparisons assume no incentives, such as tax credits or grants, to reduce the purchase cost. Where such incentives are available, EV ownership can be very attractive indeed.

Figure 2. Cumulative total cost of ownership over 15 years for the same four vehicles shown in Table 1. The purchase price of each vehicle is assumed to be financed over 5 years with 10% down payment. The chart assumes no tax credits or other incentives for EV ownership . For source, see Table 1. Source: US DOE Alternative Fuels Data Center calculator (https://afdc.energy.gov/calc/, accessed February 10, 2023).

EVs can create opportunities for additional operating cost savings when recharged with cheaper power, which is often available at night when most community-serving vehicles are not being used. Under some utility rate programs, the power stored in EV batteries can be sold back to the grid when not needed if the vehicles are equipped with two-way “vehicle-to-grid” (V2G) charging systems. School buses and other community vehicles have daily use profiles that are well suited to such “peak-saving” strategies, which increase the reliability of the grid and lower electricity costs for all community members.

Transitioning to EVs: Progress and Challenges

Like many consumers, communities are waking up to the potential opportunities offered by EVs for addressing their public health and economic needs. Two important strategies are, first, encouraging the adoption of EVs by community residents and businesses, and second, transitioning community-owned vehicle fleets to EVs. Unfortunately, progress towards adoption of EVs at the community level is slow and uneven due to a variety of challenges and barriers.

Nowhere are the advantages of EVs and the opportunities for community adoption more attractive than with electric school buses. They have become the focal point for a nationwide push led by the US EPA and other state, federal, and local agencies, which is now reaching hundreds of school districts.

The public health case for electric school buses is strong. Every school day, we expose some 20 million children to harmful fumes from school buses. A study by the Natural Resources Defense Council highlights the following finding:

We estimate that for every one million children riding the school bus for 1 or 2 hours each day during the school year, 23 to 46 children may eventually develop cancer from the excess diesel exhaust they inhale on their way to and from school. This means a child riding a school bus is being exposed to as much as 46 times the cancer risk considered “significant” by EPA and under federal law.10

Most school buses run on diesel fuel, and the particulate matter emitted from their tailpipes (which can accumulate inside the buses) is believed likely to affect brain development and contribute to asthma and other ailments that take children out of school.11 Sadly, the very means many children use to get to school may affect their ability to thrive there.

According to the World Resource Institute’s (WRI’s) Electric School Bus Initiative, over 400 school districts have committed to deploying at least one electric school bus.12 This represents only 2% of all 19,954 districts in the WRI database, and the number of electric buses so far committed – over 12,000 – is likewise small compared to the 500,000 school buses across the United States. Still, it’s a substantial development, and one that should accelerate as the cost of electric school buses declines, more funding becomes available to offset the cost of purchase, and their benefits for student and community health and district operating budgets become more widely known.

The Stockton (California) Unified School District (SUSD) is a leading example of how districts serving disadvantaged communities can embrace electric vehicles to address health problems among their student populations. Some 78% of the SUSD population is classified as low income, and 80% are eligible for free or reduced-price lunches. The students are about 80% non-white (including Latinx). As in many lower-income populations, exposure to pollutants in Stockton is high, as is the incidence of associated health problems. According to the California State Government, Stockton residents are in the 96th percentile for exposure to particulate matter in the air. At the same time, the city is in the 100th percentile for incidence of asthma.13 Air quality is a clearly vital concern for the city.

Consequently, both the state and city have made it a priority to reduce the pollution burden on Stockton residents, and especially their children. The district has already deployed 11 electric buses on school routes, representing 12% of its fleet of 90 buses, and a total of 24 are planned in the initial phase of the program. Funding to pay for the buses and the charging stations they will need – a total of $8.3 million – has come from a wide variety of sources, including the California Air Resources Board, California Energy Commission, San Joaquin Valley Air Pollution Control District, and Pacific Gas & Electric, among others.

Such funding is essential, since full-size electric school buses, which are still manufactured in small numbers, presently cost around $350,000-$400,000 each, roughly twice their diesel equivalents. Despite an annual savings of $5,000-$10,000 in fuel and maintenance costs, incentives are needed to make their purchase affordable and accessible to all communities.14 Some states are rising to the challenge. For example, the California Energy Commission created the School Bus Replacement program to subsidize the replacement of aging diesel buses with new electric buses. In New Jersey, school districts receive support for bus electrification from the Regional Greenhouse Gas Initiative (RGGI), a carbon-allowance trading program. Funds from the Volkswagen “Dieselgate” settlement can also be used to subsidize community electric vehicle initiatives.

Beyond school buses, towns and cities are moving to embrace electric vehicles. New York City has committed to creating a green transportation system for its residents, notably including:

• 100% electric city fleet by 2040
• 100% electric school bus fleet by 2035
• 1,000 curbside chargers by 2025, increasing to 10,000 by 2030
• 6,000 publicly accessible fast chargers by 2030

Other communities are moving in a similar direction.16 For example, Sacramento, California, is making shared electric cars available to the public, along with zero-emission buses and an on-demand electric van. Indianapolis, Indiana created an electric bus line, the IndyGo Red Line, connecting underserved parts of the city to high-employment areas.17 Los Angeles, California plans to convert its entire fleet of transit buses to electric buses by 2030, part of a broad package of sustainability measures.18

In subsequent blogs in this series, we will look at a new application of community EVs made possible by vehicle-to-grid technology and how it can improve resilience in the face of natural disasters and address specific policy initiatives that are needed to accelerate the deployment of EVs.


Michael Brower is the former President of AWS Truepower, LLC, a global renewable energy consulting firm, and the former Vice President for Renewable Energy at Underwriters Laboratories. A physicist by training, Michael is currently a partner at Clean Energy Ventures Group.


Footnotes: 

(1) Chris Sellers, SUNY Stony Brook: https://theconversation.com/storms-hit-poorer-people-harder-from-superstorm-sandy-to-hurricane-maria-87658. Shahir Masri et al, UC Irvine: https://www.mdpi.com/1660-4601/18/8/3921.
(2) https://news.gallup.com/poll/1615/environment.aspx.
(3) https://www.epa.gov/air-trends/air-quality-national-summary.
(4) See https://www.sciencedirect.com/science/article/pii/S1352231013004548 and https://pubmed.ncbi.nlm.nih.gov/21627672/. These estimates are based on pollution levels in 2005. The great majority – around 95% – of estimated premature mortality is caused by particulate matter.
(5) https://www.niehs.nih.gov/health/topics/agents/air-pollution/index.cfm. https://www.epa.gov/pm-pollution/health-and-environmental-effects-particulate-matter-pm. See also https://www.lung.org/getmedia/13248145-06f0-4e35-b79b-6dfacfd29a71/zeroingin-on-healthy-air-report-2022.
(6) https://www.lung.org/clean-air/outdoors/who-is-at-risk/disparities
(7) https://www.science.org/doi/10.1126/sciadv.abf4491. https://www.epa.gov/sciencematters/study-finds-exposure-air-pollution-higher-people-color-regardless-region-or-income.
(8) https://www.lung.org/getmedia/17c6cb6c-8a38-42a7-a3b0-6744011da370/sota-2021.pdf.
(9) https://www.epa.gov/sciencematters/study-finds-exposure-air-pollution-higher-people-color-regardless-region-or-income.
(10) National Resources Defense Council Coalition for Clean Air. No breathing in the aisles — diesel exhaust inside school buses. New York: The Council; January 2001. Available: www.nrdc.org/air/transportation/schoolbus/sbusinx.asp. Also https://www.edf.org/sites/default/files/5342_School_bus_pollution_studies.pdf
(11) https://www.ncbi.nlm.nih.gov/pmc/articles/PMC5017593/
(12) https://datasets.wri.org/dataset/electric_school_bus_adoption
(13) https://oehha.ca.gov/calenviroscreen/census-tract/6077000100
(14) https://info.aee.net/hubfs/California%20Electric%20School%20Bus%20FAQ.pdf
(15) https://www1.nyc.gov/site/sustainability/achievements/sustainable-transportation.page
(16) See, e.g., https://archive.curbed.com/2018/9/18/17873726/transportation-best-cities-bus-scooter-light-rail-public-transit. Needs updating.
(17) https://archive.curbed.com/2018/9/18/17873726/transportation-best-cities-bus-scooter-light-rail-public-transit
(18) https://www.transit.dot.gov/sites/fta.dot.gov/files/2022-03/LA-Metro-Sustainability-Strategic-Plan-2020.pdf